

Many business owners and entrepreneurs recognize the power of marketing, and its role in growing their companies. Where it gets sticky though, is how much to invest in marketing.
We understand that. But the investment conversation becomes much easier when you have metrics associated with your marketing so you can see what its doing for your organization and how its contributing to the bottom line.
Gone are the days of looking at marketing efforts as expenditures.
In today’s data-driven, multi-channel marketing world, marketing efforts are (and should be) a revenue builder. Proving the worth of marketing efforts to everyone else in the C-suite, and producing the best return on investment, is the challenge.
That is where metrics come in.
Metrics are essential to marketing performance.
Today’s marketers have to become data scientists, not known just the ‘artsy-crew.’ The benefit to these measurements in your own marketing department is having exact information to identify both issues and opportunities in your content strategies.
With the many multi-channel initiatives we utilize, there are a myriad of options for analytics, and sorting through them can be an arduous task.
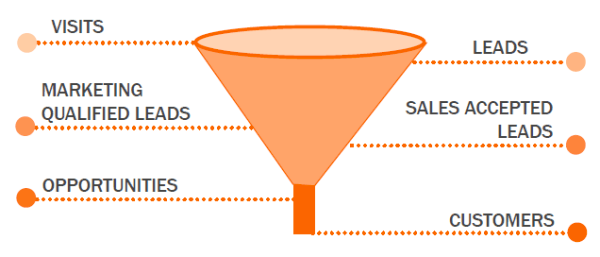
Here, at Simple Strat, we compiled our top ten marketing measurements for you to implement into your team’s strategies. To help guide you through the metric maze, we arranged the metrics we have used at various stages of the sales and marketing funnel, and provided the metrics we believe will be most useful for you, no matter your level of analytic expertise.

Basic Metrics = Gaining Awareness [Top of the funnel]
If you are feeling overwhelmed with where to begin with metrics, start with the basics. Basic metrics deal with consumption; or how many people have viewed your content.
IMPRESSIONS / REACH / FREQUENCY
Impressions are the total number of exposures to your content. One person can receive multiple exposures over time. If one person saw an ad seven times, the number of impressions would be seven.
Reach is the number of people in the market that will likely be exposed to one spot. Estimating reach can be challenging when running an ad in the same market multiple times.
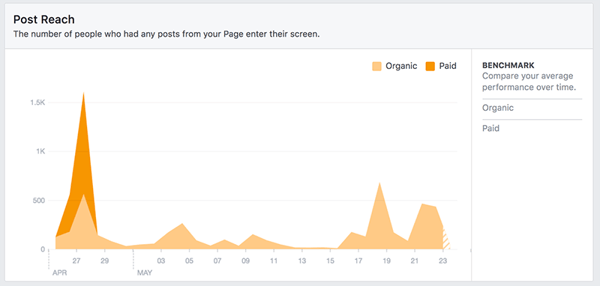
Frequency is the average number of times content is presented to the reached population. Frequency can be calculated by dividing the number of impressions by the reach.
WEBSITE TRAFFIC
Web analytics give insight to how visitors are interacting with your site. Metrics can show how many visitors were on your site each day, if there are patterns to the number of visits (does this coincide with other marketing efforts), where your visitors are coming from, what pages they are visiting, and what type of device they are using.
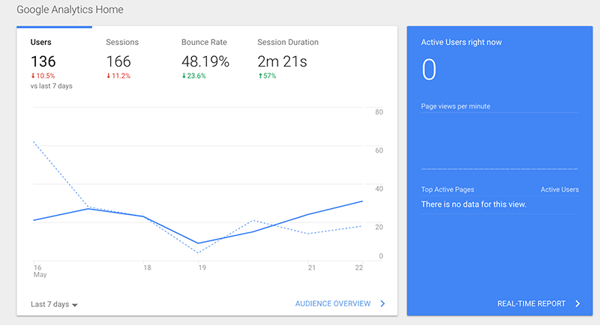
A typical breakdown of metrics here is number of unique visitors and traffic to specific pages, such as product pages or contact forms.
SOCIAL METRICS
Social media—Facebook, Twitter, Instagram and LinkedIn—all include dashboards with insights to users and their engagement with your content. Some metrics are universal, and some are calculated differently based on the platform.
Basic Facebook metrics include likes, reach, visits, posts, engagement and people. You can even compare your stats with your competitors.
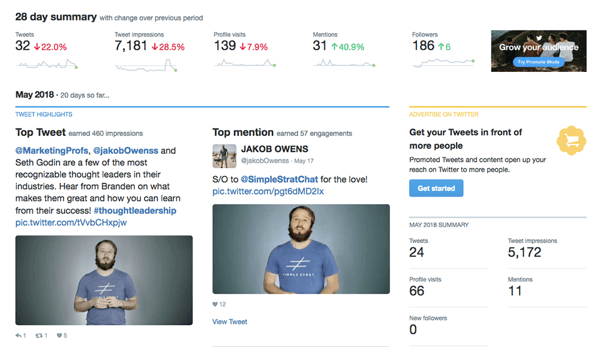
Twitter analytics are not as detailed, but you can receive month-by-month summaries of tweets, tweet impressions, profile visits, mentions, followers, and tweets linking to you. Beyond that is engagement rate, link clicks, retweets, and demographic breakdowns.
Instagram offers impressions, follower demographics, reach, profile views, saved posts and engagement. Instagram also offers “top posts” where you can see your best performing posts by specific metrics.
LinkedIn also offers an analytics tab to learn more about your audience. LinkedIn metrics include impressions, clicks, interactions, followers and engagement. If you’re looking at LinkedIn metrics on your personal profile, you can see how many views you got on your profile, as well as the activity (engagement) on any content you post (updates, videos, etc).
Basic metrics are a great place to start, but honestly, you need to keep moving down the funnel or you run the risk of gathering “vanity metrics” to suggest the ROI of your marketing efforts.
Wouldn’t you like to know if your prospect is engaged with your content, and for how long?
Engagement metrics will let you know if your audience is loyal, and the more loyal your reader, the more opportunity you have to push them closer to the sale.
Conversion Metrics [Middle of the sales funnel]
LEAD CONVERSIONS
A lead conversion occurs when a person ‘converts’ an existing lead into an account/contact/opportunity (ie, you received their contact information in some way).
This information is transferred to the sales team to begin the sales process. For example, maybe a person submitted a form to download a whitepaper. If the individual is interested, the contact is considered a qualified lead and passed on to the sales department.
Lead conversion metrics include the number of leads, qualified leads, and win rates. Deeper dives can lead into the average deal size, win rates by salesperson, and so on. If you have a sophisticated marketing department, and good sales and marketing alignment, you may also have MQLs (marketing qualified leads) and SQLs (sales qualified leads) – more on that below.
COST PER LEAD
The cost per lead metric measures how cost-effective your marketing campaigns are.
This metric ties into key business metrics such as the cost to acquire new customers. The purpose of this metric helps provide a dollar figure to help understand how much money is appropriate to spend on acquiring new leads. The ultimate goal is to minimize the cost per lead. It’s also a good way to gauge overall effectiveness, as you’ll want to stop a marketing campaign that costs more than the revenue gathered from a sale.
MARKETING QUALIFIED LEADS
If faced with the disconnect that often happens between marketing and sales, you’ll quickly discover that marketing qualified leads are usually the culprit.
Marketing departments can generate a multitude of leads, but if those leads do not have a propensity to purchase, then they are a waste of money once submitted to the sales team. And, tracking marketing qualified leads includes tracking many data points to get a clear picture of what is working, and what is not.
SALES QUALIFIED LEADS
Low and behold, many sales departments will tell you that MQLs are not enough. They want more! They will set additional criteria for the leads to be considered qualified. Many sales departments now will only consider leads that have had a direct conversation, hearing first-hand that they are interested in purchasing the product and why they are interested in buying.
The key thing to remember with MQLs and SQLs is that there are recommendations as a whole, but it’s up to your own organization to determine what makes someone more qualified in each part of the process. Once you develop these definitions, it’s imperative that your teams revisit this to ensure alignment between the two groups as they’re both working toward the same goal.
Sales Metrics [Bottom of the sales funnel]
SALES CONVERSION RATE
Knowing your conversion rate is the first step in understanding how your sales funnel is performing and what marketing avenues are giving the best ROI (return on investment).
Determine which conversions you want to track, then you can determine your conversion rate (in this case, a conversion = a sale).
Conversion rate = total number of sales / number of leads

LIFETIME CUSTOMER VALUE
The value of the lifetime of the customer is the net dollars a customer is worth to you from the moment they become a customer to the moment they are no longer a customer.
We think you’ll find that it is much less expensive to keep a customer than to acquire a new one. A general rule of thumb is to allocate 15 percent of the customer lifetime value to the acquisition cost. This also reinforces the need to continue to build the relationship once they become a customer, as you can cross sell, upsell, and delight them to refer their friends.
COST PER CUSTOMER ACQUISITION
Cost per customer acquisition is a fancy name for cost per sale. This metric is probably one of the more difficult ones to track unless you track leads and acquisitions by source.
The easiest way is to break it down by campaign.
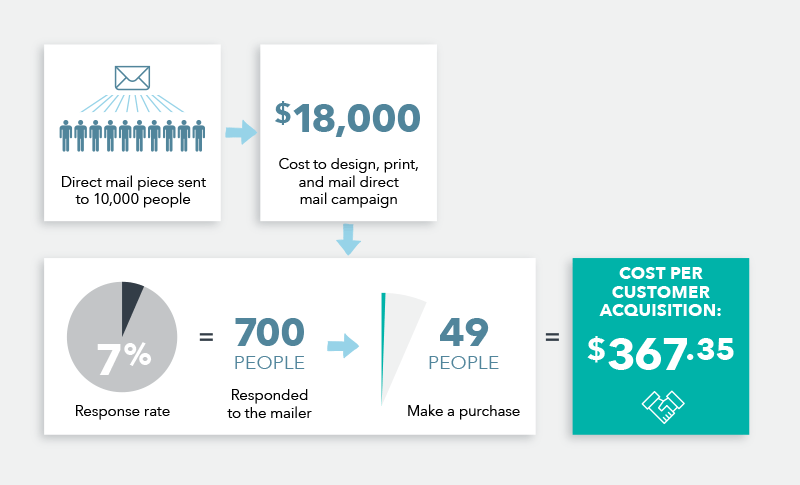
Here’s an example:
If you develop a direct mail piece and send it to 10,000 people, and your campaign cost is $18,000 (design/print/mail), the response rate is 7% (lofty goals). Based on this example, 700 people would respond to the mailer, 49 people that purchase. Thus, the acquisition rate would be $367.35. Comparing that to what 15 percent of the Lifetime Customer Value can help you determine whether this marketing initiative is in line with your goals.
Conclusion:
The main goal of using marketing metrics and analytics is to progressively improve the overall performance of the brand. Utilizing metrics helps communicate and demonstrate reasons for marketing activities, and their importance in the overall success of the organization.
These metrics can help justify the need for what’s included in your budget when it is measured to the company’s return on investment.
Questions about metrics? Drop us a note in the comments below or tweet us at @simplestratchat.