

One of the best things about HubSpot is its ability to deliver insights about your organization’s performance across marketing, sales, and customer success. But unlocking those insights does require you to know a thing or two about how to best use HubSpot’s reporting capabilities.
Done well, HubSpot reporting gives your business comprehensive yet digestible insights that help you make informed decisions quickly. That means whether you’re assessing your latest marketing campaign, figuring out if your sales team is closing more deals with AI, or satisfying reporting requirements from investors or a board, HubSpot can deliver the answers you seek.
The basis for good reporting in HubSpot
We advocate a “report first” approach when helping clients set up HubSpot. Since getting clear, valuable insights is often a primary goal, we believe it only makes sense to start there from the beginning.
This approach keeps everyone focused on the answers we want to learn from our use of HubSpot, and it helps to clarify what data we’ll need to have access to in the platform.
For instance, when a credit union client of ours wanted to know what percentage of website visitors opened new accounts and what marketing activities were most successful in generating new-account signups, it became clear that we'd need to set up an integration with their systems to make sure HubSpot knew when a new account had been created.
This experience underscores the value of starting with reports in mind: the approach helps you identify what you don't know, enabling you to make the required adjustments to your HubSpot setup. It's not just about the end numbers, but understanding what data and configurations are needed to get there in the first place.
Laying the foundation for effective reporting in HubSpot
To ensure successful reporting in HubSpot, be sure to take a deliberate, systematic approach. We recommend our clients start like this:
- Identify the questions: Start by pinpointing the specific questions you need your reporting to answer. These could range from understanding customer behavior to tracking sales performance. Be sure to involve all necessary stakeholders in this process and consider your businesses primary goals and challenges.
- Determine the necessary data: Once you've identified the questions, assess the data required to build insightful reports. This may involve creating custom properties, utilizing custom objects, and/or integrating with other systems to gather all the necessary information. It also dictates the information you’ll need to collect on forms, from salespeople, and from lead enrichment tools.
- Build the reports: With a clear understanding of your questions and the data at hand, proceed to construct the reports needed. Adopting a "report first" approach ensures that your setup in HubSpot is tailored to answer your questions effectively.

As you begin building out the reports, keep an eye out for these common pitfalls:
3 common pitfalls to watch for in HubSpot reporting
1. Neglecting strategic planning in your reporting
This essentially boils down to ignoring Steps #1 and #2 above. Often, reporting is either treated as an afterthought, or new users get carried away making a bunch of reports, many of which end up being unnecessary. To ensure data-driven decision-making, it's crucial to begin by carefully considering the questions you aim to answer and ensuring you have all the data you’ll need.
2. Incorrect use of filters
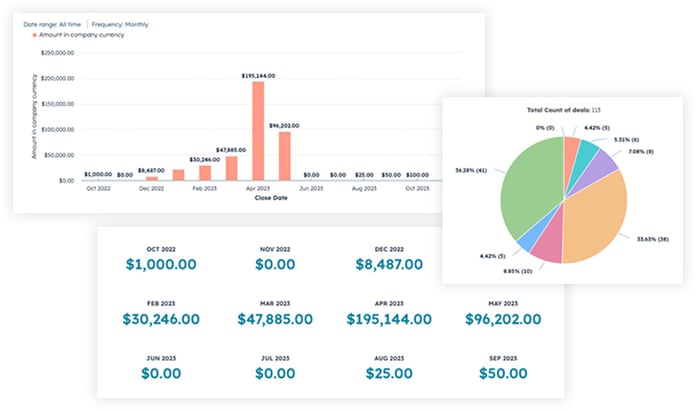
HubSpot's default filters often focus on the “created” dates of objects in the report, like deals or contacts, which can lead to the appearance of missing or inaccurate data. For example, if you’re trying to report on revenue in “closed-won” deals last quarter, a report filtered by deals created last quarter would display inaccurate data (instead you would want the filter to be based on the deals’ close dates). Be sure to regularly check and adjust filters to ensure your reports concentrate on the metrics that are crucial to you.
3. Premature use of the Custom Report Builder
While HubSpot offers a highly capable custom report builder for its Professional and Enterprise versions, diving into it before fully understanding the platform can be overwhelming.
If you’re just getting started with HubSpot reporting (or if you just want to save some time), we recommend starting with the pre-built reports in the report library. You may find the exact report you need or something close to it. You can then make adjustments to filters or customize it further if necessary so you don’t have to start from scratch. Check out HubSpot’s Knowledge Base article to learn more, or the HubSpot Academy course on it.
Want to make HubSpot reporting more helpful? Follow these best practices:
1. Be deliberate and strategic when creating reports
Instead of creating reports just for anything and everything (as tempting as this can be sometimes), be intentional about what you're trying to measure. Ask yourself why it matters to your business and what part of your operations it's driving. This approach helps you use the system more effectively and structures your reporting in a way that's genuinely useful.
2. Simplify your approach
It's easy to get carried away with HubSpot's extensive reporting features. However, the key is to keep it simple. Don't overcomplicate your reports with too many metrics or visualizations. Focus on what you're trying to accomplish and what you'll actually do with the report.
3. Prioritize data quality (and set up integrations when needed)
Your reporting is only as good as the data you have. Often, you'll need custom properties, and some may need to be calculated or updated automatically by workflows. You may also need to integrate data from external sources like ERPs, proprietary systems, other marketing tools, and/or accounting software to get a complete picture.
4. Use the right tools for the job
HubSpot offers various types of report visualizations. Make sure you're using the one that best represents the data you're trying to showcase. Also, before creating a new report, check HubSpot's report library to see if there's a pre-existing report that meets your needs.
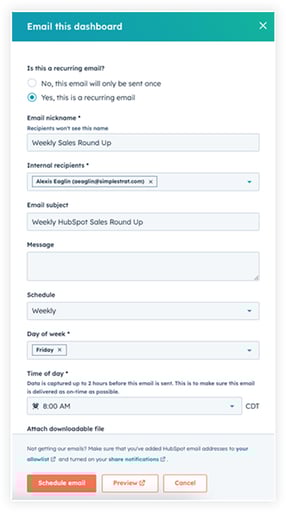
5. Automate dashboard reporting
To keep stakeholders in the loop, set your dashboards to automatically send updated data at regular intervals. Reports can be filtered differently depending on the stakeholder (salesperson, sales manager, VP of sales, etc). This practice ensures that everyone is on the same page without having to manually pull data each time.
How to Set Up and Customize Your HubSpot Dashboards
6. Leverage saved views
Filtered lists of records often need to be built out as reports in other CRM systems, but HubSpot’s saved views are often the best way to do this and don’t require you to create a report at all. Saved views are more intuitive, efficient, and flexible, and can more easily be put to use by different team members.
Setting Up and Using HubSpot Saved Views
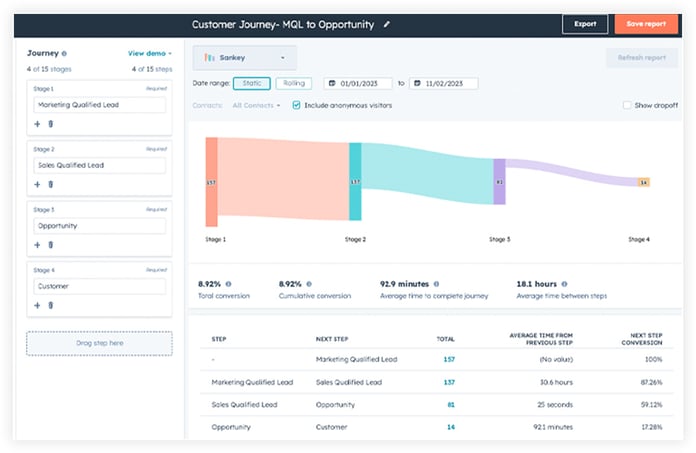
7. Use customer journey analytics (Enterprise only)
If you're an Enterprise user, don't overlook the customer journey analytics feature. It can provide valuable insights into how customers interact with your business at various touchpoints.
8. Collaborate with teams
HubSpot allows multiple users to collaborate on a single report. Use this feature to get input from different departments for a more comprehensive analysis.
9. Monitor lifecycle stages
Use the lifecycle stages feature in HubSpot to gain valuable insights into your marketing and sales funnels. Some businesses overlook this property (or create custom properties that serve a similar purpose), but utilizing lifecycle stages offers several advantages.
For instance, by categorizing leads with the default lifecycle stages property, you can access a range of pre-built reports that provide key data. This includes insights into the pace at which leads progress through the funnel, conversion rates between stages, and more.
Properly implementing lifecycle stages allows you to identify both bottlenecks and opportunities for improvement, thereby enhancing your overall sales strategy.
The Expert Guide to HubSpot Lifecycle Stages
10. Combine related reports on dashboards to tell the full story
HubSpot allows you to combine related reports on your dashboard, weaving them together to tell a complete story of what’s happening. By strategically organizing your reports, your dashboard can provide a holistic view of your sales journey.
This approach enables you to analyze key performance indicators (KPIs), such as meetings booked or leads generated, in a contextual manner. By viewing these interconnected reports, you can identify root causes of issues and spot opportunities for impactful changes. This method ensures that your dashboard not only presents data but also tells a compelling story that guides strategic decision-making.
To do this well, first consider the KPIs most important to you and add reports for those. Then, consider what leading metrics affect those KPIs, and add reports for those too. Continue until your dashboard tells you the full story of your KPIs and everything that leads to them.
Use HubSpot to level up more than just reporting capabilities
Whether you're new to HubSpot or looking to optimize your current setup, we're here to help you get the most out of the platform. If you're ready to make informed decisions based on accurate, insightful reporting, book a call with us today.